Διαβάζοντας το Docker Stats & το top σε Production Server: CPU, RAM, και Γιατί η «Used» Μνήμη Φαίνεται Υψηλή
- Stylianos Asmargianakis
- Docker , Dev ops
- 10 Αυγούστου 2025
Table of Contents
Όταν τρέχετε docker stats δίπλα στο top, οι αριθμοί σπάνια ταιριάζουν με το mental model σας. Η χρήση μνήμης φαίνεται «πολύ υψηλή», το CPU «sy» είναι μεγαλύτερο από όσο περιμένατε, και η ελεύθερη RAM είναι μικροσκοπική — κι όμως όλα δουλεύουν κανονικά.
Αυτό το post εξηγεί τι βλέπετε, πώς σχετίζεται (CPU/RAM/cgroups), και γιατί το Linux δείχνει λίγη ελεύθερη μνήμη αλλά πολλή «διαθέσιμη». Θα σας δείξω επίσης πώς να κάνετε sanity-check στα όρια, να αποφύγετε OOMs, και να ερμηνεύσετε το I/O.
Στα παραδείγματα παρακάτω έχω αντικαταστήσει πραγματικά domains με placeholders όπως
example1,example2, κ.λπ.
1) Τι Δείχνει το docker stats (και τι δεν δείχνει)
Ένα τυπικό απόσπασμα docker stats --no-stream:
CONTAINER ID   NAME                   CPU %     MEM USAGE / LIMIT     MEM %     NET I/O           BLOCK I/O         PIDS
6c43d6d1fbd2   shop_prestashop        0.01%     233.3MiB / 768MiB     30.38%    11GB / 4.85GB     590MB / 1.26GB    4
18ae2ae3cf55   shop_db                0.01%     305MiB / 512MiB       59.58%    2.57GB / 11GB     76.3MB / 167MB    15
32efa5e4125a   example1_wordpress     0.07%     151.4MiB / 1GiB       14.79%    10.9GB / 12GB     51.8GB / 12.2GB   20
82f1e46ba22f   example1_db            0.02%     139.1MiB / 1GiB       13.58%    96.4MB / 203MB    26.3MB / 60.1MB   9
0a66cdb6dcc1   example2_forum         0.69%     37.53MiB / 1GiB       3.67%     22.9GB / 1.52GB   8.72MB / 0B       5
e0c1e88ea1e6   example2_db            0.46%     195.8MiB / 1GiB       19.12%    792MB / 22.7GB    33MB / 389MB      15
7294a4870cd9   example3_wordpress     0.14%     136.8MiB / 768MiB     17.81%    4.21GB / 1.5GB    83.5MB / 12.4MB   6
35489d5958a6   example3_db            0.01%     110.9MiB / 512MiB     21.65%    53.1MB / 53MB     13.7MB / 98.2MB   8
Βασικές στήλες:
- CPU % — ποσοστό ενός μοναδικού host CPU (μπορεί να ξεπεράσει το 100% αν είναι multi-core και ένα container χρησιμοποιεί περισσότερους από 1 πυρήνα). Στιγμιαίο snapshot, όχι μέσος όρος.
- MEM USAGE / LIMIT — χρήση μνήμης cgroup του container έναντι του ορίου μνήμης του container (π.χ.
768MiB). Αν δεν υπάρχει όριο, δείχνει τη μνήμη του host ως παρονομαστή. - MEM % — χρήση ÷ όριο.
- NET I/O — bytes εισερχόμενα/εξερχόμενα από την εκκίνηση του container (αθροιστικά).
- BLOCK I/O — αναγνώσεις/εγγραφές σε storage από την εκκίνηση του container (αθροιστικά).
- PIDS — διεργασίες/threads μέσα στο container (οι μετρήσεις μπορεί να είναι υψηλότερες με pools PHP-FPM, threads DB, κ.λπ.).
Σημαντικό: Το
MEM USAGEείναι μέσα στο cgroup. Δεν περιλαμβάνει το page cache του συστήματος αρχείων του host που χρησιμοποιείται εκτός του path λογιστικής του cgroup του container (εκτός αν ο daemon είναι ρυθμισμένος για ενοποιημένη λογιστική cgroup-v2 με reclaim του page cache συνδεδεμένο στο cgroup). Οπότε τοdocker statsκαι τοtopδεν θα ταιριάζουν ποτέ 1:1.
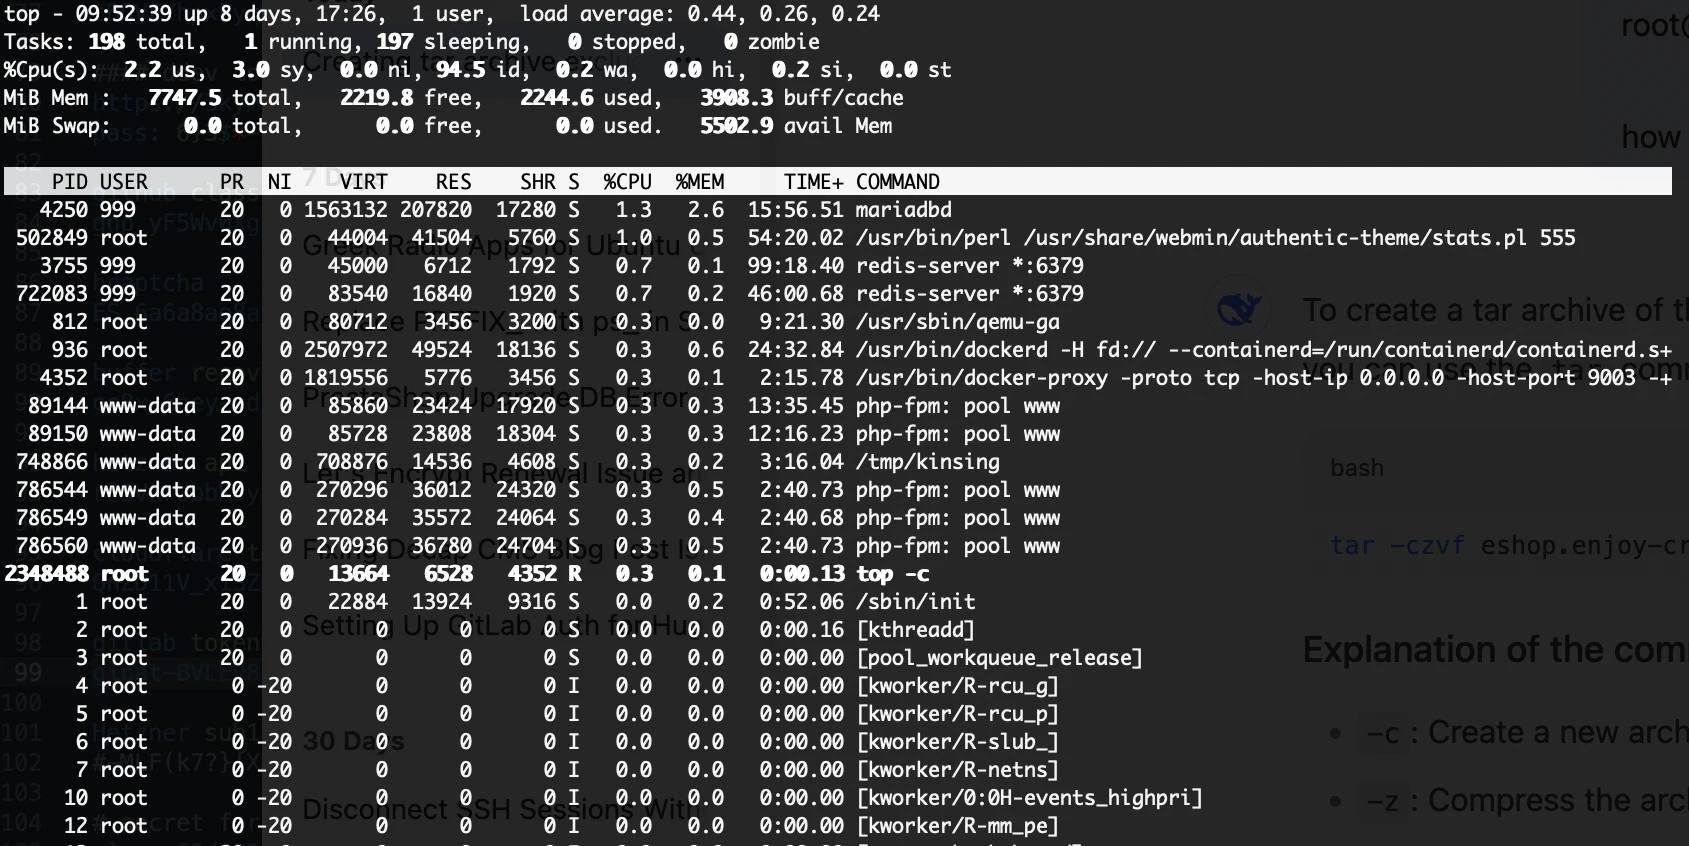
2) Τι Δείχνει το top — και Γιατί η «Ελεύθερη» RAM Είναι Χαμηλή
Μια τυπική κεφαλίδα top:
top - 09:46:41 up 8 days,  load average: 0.30, 0.36, 0.27
Tasks: 194 total,   1 running, 193 sleeping
%Cpu(s):  4.0 us, 12.0 sy, 0.0 ni, 80.0 id, 0.0 wa, 0.0 hi, 4.0 si, 0.0 st
MiB Mem :   7747.5 total,    922.0 free,   2186.6 used,   5264.2 buff/cache
MiB Swap:      0.0 total,      0.0 free,      0.0 used.   5560.9 avail Mem
- Το
freeείναι μικρό — Το Linux χρησιμοποιεί επιθετικά τη μνήμη για page cache και slab (φαίνεται κάτω από τοbuff/cache) για να επιταχύνει το I/O δίσκου. Αυτή η μνήμη είναι ανακτήσιμη όταν οι εφαρμογές τη χρειαστούν. - Το
availableείναι ο πραγματικός χώρος — εδώ,5560.9 MiB. Αυτό εκτιμά πόση μνήμη μπορεί να δοθεί σε εφαρμογές χωρίς swapping (ακόμα και με buffers/caches παρόντα). - Γραμμές CPU:
us= δουλειά σε user-space (ο κώδικας της εφαρμογής σας).sy= δουλειά σε kernel-space (syscalls, networking, VFS, λογιστική cgroups).si= software interrupts (π.χ. επεξεργασία πακέτων δικτύου υπό φόρτο).wa= I/O wait (μπλοκαρισμένο σε storage — συχνά προειδοποιητικό σημάδι).st= stolen time (virtualization — ο hypervisor πήρε CPU).
Γιατί φαίνεται ότι η RAM είναι «δεσμευμένη»: Το Linux σκόπιμα γεμίζει τη μνήμη με cache για να αποφύγει αναγνώσεις δίσκου. Δεν είναι leak· είναι feature. Όταν μια διεργασία χρειαστεί μνήμη, ο kernel αδειάζει σελίδες cache και δίνει RAM σε αυτόν που τη ζητά. Γι’ αυτό το
availableείναι ο αριθμός που πρέπει να παρακολουθείτε, όχι τοfree.
3) Αντιστοίχιση Containers με τη Χρήση του Host
- Όρια cgroup vs σύνολα host: Ένα container με
MEM USAGE / LIMIT = 600MiB / 1GiBσυνεισφέρει ~600 MiB στο «used» του host, συν όποιο page cache κρατά ο host για τα αρχεία του εκτός του path λογιστικής του cgroup. Με cgroup v2, το cache μπορεί να αποδοθεί πιο στενά ανά cgroup αν έχει ρυθμιστεί. - Πολλαπλά containers: Η άθροιση όλων των τιμών
MEM USAGEτων containers θα υποεκτιμήσει τη μνήμη του host επειδή:- Οι host daemons (Docker, journald, sshd) καταναλώνουν επίσης RAM.
- Η μνήμη kernel, το slab, και το page cache είναι εκτός containers (εκτός αν αποδίδονται).
- Τα tmpfs volumes, τα overlayfs metadata, και το cache του συστήματος αρχείων διογκώνουν το
buff/cache.
Mental model:
Host used ≈ sum(container RSS) + host services + kernel + page cache
Οπότε το «host used» > «άθροισμα μνήμης docker stats» είναι φυσιολογικό.
4) CPU: Γιατί το sy Μπορεί να Είναι Μη Αμελητέο σε Container Hosts
Μπορεί να δείτε sy (system) στο ~10–15% ακόμα και με χαμηλό CPU εφαρμογής. Λόγοι:
- Χειρισμός network stack (NAT/bridge/overlay), κανόνες iptables/nftables, conntrack.
- Δουλειά συστήματος αρχείων (overlayfs, page cache, διαχείριση dentry/inode).
- Λογιστική cgroup και context switches μεταξύ πολλών containers/PHP-FPM workers.
- Τερματισμός TLS, logging, housekeeping του container runtime.
Πότε να ανησυχείτε: Παρατεταμένο υψηλό sy (π.χ. >30%) με χαμηλό us μπορεί να δείχνει φλύαρο I/O, packet floods, ή αναποτελεσματικά patterns συστήματος αρχείων. Ελέγξτε iostat, pidstat -w, perf top, εργαλεία bpftrace/bcc, ή μειώστε την πολυπλοκότητα δικτύου/iptables.
5) Load Average vs Χρήση CPU
- Το Load average μετρά διεργασίες που τρέχουν ή είναι uninterruptible (D) (συχνά I/O). Σε σύγχρονα multicore hosts,
load ~ 0.3με 4+ πυρήνες είναι ασήμαντο ακόμα κι αν ένα container έχει spike. - Υψηλό load με χαμηλό
us/syσυχνά σημαίνει μπλοκαρισμένο I/O (τοwaανεβαίνει). Δείτε τις μετρήσεις δίσκου και τοBLOCK I/Oτου container.
6) Ερμηνεία Στηλών I/O
Από το docker stats:
- Το NET I/O (αθροιστικό) βοηθά να εντοπίσετε φλύαρα containers (reverse proxies, sites WordPress με κίνηση).
- Το BLOCK I/O (αθροιστικό) αναδεικνύει τους «χτυπητές» δίσκου (DBs, caches που κάνουν flush στο δίσκο, loggers).
- Ξαφνικές μεγάλες εγγραφές από ένα container WordPress συχνά προέρχονται από ανεβάσματα εικόνων, plugins cache που γράφουν, ή αύξηση logs.
Συνδυάστε με εργαλεία host:
iostat -xz 2
pidstat -d 2
dstat -tcdnm 2
7) Πρακτικά Κατώφλια & Ειδοποιήσεις (εμπειρικός κανόνας)
- Διαθέσιμη RAM host < 10–15% επίμονα → ερευνήστε όρια, caches, ή memory leaks.
- Container MEM % > 80–90% για μεγάλα διαστήματα → αυξήστε το όριο ή ρυθμίστε την εφαρμογή (αποφύγετε OOM).
wa(I/O wait) > 5–10% σταθερά → χρειάζεται tuning storage ή query.- PIDS που ανεβαίνουν χωρίς όριο → ελέγξτε max children/threads PHP-FPM/DB, cron storms.
8) Ρυθμίσεις & Διορθώσεις που Θα Χρησιμοποιήσετε Στην Πράξη
Ορίστε λογικά όρια container (Docker Compose):
services:
  example1_wordpress:
    mem_limit: 1g
    cpus: 0.50
  example1_db:
    mem_limit: 1g
    cpus: 0.50
Σωστό μέγεθος caches DB:
- MariaDB/MySQL: ρυθμίστε το
innodb_buffer_pool_sizeσε ένα κλάσμα του ορίου του container (π.χ. 50–70%), όχι του host RAM.
PHP-FPM:
- Ορίστε
pm = dynamic, ρυθμίστε τοpm.max_childrenβάσει μνήμης ανά worker (μετρήστε μεps,smem).
Logs:
- Κάντε rotate επιθετικά (
logrotate) και σκεφτείτε να τα στέλνετε σεjournald/aggregator για να μειώσετε το churn του συστήματος αρχείων.
Συμπεριφορά cache:
- Μην κάνετε «drop caches» τακτικά (
echo 3 > /proc/sys/vm/drop_caches) σε production — βλάπτει την απόδοση. Αν πρέπει να δοκιμάσετε, κάντε το μία φορά και μετρήστε πριν/μετά.
Kernel hints (προχωρημένο):
vm.vfs_cache_pressure(υψηλότερο → πιο επιθετικό reclaim dentries/inodes).vm.swappiness(άσχετο αν δεν έχετε swap, αλλά σκεφτείτε ένα μικρό zram swap για να απαλύνει bursts).
9) Γρήγορο Checklist Όταν «η Μνήμη Φαίνεται Γεμάτη»
- Κοιτάξτε το
availableστοtopήfree -h— όχι τοfree. - Αθροίστε το
MEM USAGEτων containers· περιμένετε να είναι λιγότερο από το «used» του host. - Ελέγξτε το ιστορικό OOM:
dmesg -T | egrep -i 'killed process|out of memory|oom' - Επιθεωρήστε τους μεγάλους καταναλωτές:
ps aux --sort=-rss | head -20 - Για πραγματική χρήση ανά διεργασία (shared vs private):
smem -tk
10) Συχνές Ερωτήσεις
Ε: Γιατί ο host δείχνει 5–6 GiB «used» ενώ τα containers μου αθροίζουν σε ~1–2 GiB;
Α: Το υπόλοιπο είναι page cache, slab, και υπηρεσίες host. Είναι φυσιολογικό. Χρησιμοποιήστε το available για να εκτιμήσετε την πίεση.
Ε: Μπορεί το docker stats να «λέει ψέματα»;
Α: Αναφέρει μνήμη λογιστικής cgroup. Διαφορές με τις προβολές του host είναι αναμενόμενες λόγω ορίων caching/λογιστικής.
Ε: Πρέπει να καθαρίσω το cache για να «ελευθερώσω» μνήμη; Α: Όχι, το Linux θα το ανακτήσει όταν χρειαστεί. Το άδειασμα cache μειώνει την απόδοση και σπάνια είναι απαραίτητο.
Τελικές Σκέψεις
- Το
docker statsσας λέει πώς συμπεριφέρεται κάθε container μέσα στα όρια cgroup του. - Το
topσας λέει πώς ο kernel του host διαχειρίζεται όλη τη μνήμη, συμπεριλαμβανομένου του page cache που κάνει το Linux γρήγορο. - Χαμηλό
freeμε υψηλόavailableείναι υγιές. Ανησυχήστε όταν τοavailableμειώνεται ή όταν τα containers ζουν κοντά στα όριά τους και προκαλούν OOMs.
Μόλις το αφομοιώσετε αυτό, εκείνοι οι «μυστηριώδεις» αριθμοί αρχίζουν να βγάζουν απόλυτο νόημα — και θα ξέρετε ακριβώς τι να ρυθμίσετε στη συνέχεια.